

Planning & Progress Study 2018
The 2018 Planning & Progress Study seeks to provide unique insights into U.S. adults’ attitudes and behaviors toward money, financial decision-making, and the broader landscape issues impacting people’s long-term financial security. The study is based on an online survey of 2,003 U.S. adults age 18+ conducted from March 7-19, 2018 (and an oversample of 601 interviews with U.S. Millennials age 18-34 which has been combined with the general population of those age 18-34 when featuring this group). Data were weighted to be representative of the U.S. population (age 18+) based on Census targets for education, age/gender, race/ethnicity, region and household income.

Americans feel underprepared for the financial realities of retirement, according to new data from Northwestern Mutual. Nearly eight in 10 (78%) Americans are “extremely” or “somewhat” concerned about affording a comfortable retirement while two thirds believe there is some likelihood of outliving retirement savings.
These fears are substantiated by further data highlighting dramatic savings shortfalls and ebbing confidence in social safety nets.
- One in five Americans (21%) have NO retirement savings at all
- One in three Baby Boomers (33%), the generation closest to retirement age, only have between $0-$25,000 in retirement savings
- Three quarters of Americans believe it is “not at all likely” (24%) or only “somewhat likely” (51%) that Social Security will be available when they retire
- Nearly half (46%) of adults have taken no steps to prepare for the likelihood that they could outlive their savings

This is the initial set of findings from the 2018 Planning & Progress Study, an annual research project commissioned by Northwestern Mutual that explores Americans’ attitudes and behaviors toward money, financial decision making, and the broader landscape issues impacting long-term financial security.
Living Long…and Working Longer
Concerns about financial security in retirement are leading people to work longer. In fact, more working Americans anticipate retiring at 70 years or older (38%) than in the more traditional 65-69 age range (33%).
Among the more than half (55%) of Americans who believe they will have to work past age 65 from necessity, 73% cited “not enough money to retire comfortably” as the dominant driver.
Other reasons mentioned include:

- Social Security not being sufficient to take care of their needs (61%)
- Concerns over rising costs like healthcare (52%)
For those who plan to work past 65 by choice, disposable income (55%) and professional satisfaction (54%) were near equal motivators. This is a notable contrast to 2015 Planning & Progress Study findings where career enjoyment was the leading driver (66%) followed by interest in additional income (60%).
Download the 2018 Planning and Progress Study – Living Long and Working Longer

Financial security emerged as the most important attribute of a positive outlook on life, according to new research released today by Northwestern Mutual. An overwhelming 9 in 10 Americans (87%) agree that nothing makes them happier or more confident than feeling like their finances are in order.
These are the latest findings from the 2018 Planning & Progress Study, an annual research project commissioned by Northwestern Mutual that explores Americans’ attitudes and behaviors toward money, financial decision making, and the broader landscape issues impacting people’s long-term financial security. The first set of data around retirement savings was released in May.
Money Mayhem
While nearly seven in 10 Americans (68%) said they feel happy about their financial situation at least sometimes, a good portion also consistently experience a range of negative emotions such as:
- Anxiety (54%) (25% “all the time” or “often”)
- Insecurity (52%) (24% “all the time” or “often”)
- Fear (48%)

Money also emerged as the dominant source of stress (44%), dramatically outpacing personal relationships (25%) and work (18%). This is not surprising, considering that the following are just some of the financial pressures causing at least four in 10 Americans to experience “high” or “moderate” levels of anxiety:
- Rising cost of healthcare: 59%
- Unplanned financial emergency: 55%
- Unplanned health emergency: 53%
- Income: 48%
- Level of savings: 48%
- Debt: 42%
- Planning for retirement: 41% --- up from 37% in 2017

The psychological and lifestyle implications of financial anxiety are sobering. More than a quarter of Americans (28%) said that financial anxiety makes them feel depressed at least monthly, with 17% suffering depression as often as weekly, daily, and even hourly. Other effects people experience at least a few times a year include:
- Impact on relationships with spouses/partners: 41%. In fact, 1 in 5 (19%) Americans said they have financial disagreements with their significant other at least monthly
- Missing out on social events: 45%
- Issues with family members other than partners/spouses: 38%
Download the 2018 Planning and Progress Study – Money and Emotions
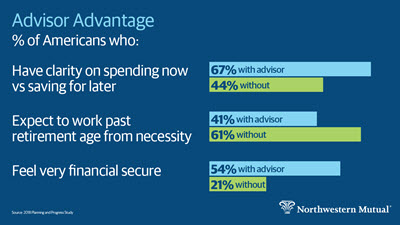
Two thirds of Americans find it challenging to navigate spending now versus saving for later --- and a financial advisor may be the solution. According to the latest findings from Northwestern Mutual’s 2018 Planning & Progress Study:
- Nearly 7 in 10 (67%) Americans who use a financial advisor believe they have clarity on how much to spend now and save for later compared to less than half (44%) of those without an advisor
- Individuals without an advisor are more than twice as likely as people with an advisor (34% vs 13%) to say they are “not at all confident” they have the balance between spending and saving correct. This may be one reason why those without an advisor are more likely than those with an advisor (60% vs 37%) to point to debt reduction as a top priority
Study results also showed Americans who work with financial advisors demonstrate higher levels of retirement readiness, disciplined planning, and financial confidence. Specifically:
- More than half (54%) of those with an advisor feel very financially secure. Only a fraction of people (21%) without an advisor said the same
- Three quarters (75%) of Americans with advisors consider themselves “disciplined” or “highly disciplined” financial planners relative to just 37% of those without an advisor
- More than 7 in 10 people with an advisor said their plan has been created to endure market cycles --- compared to less than a third of those without an advisor (29%)
- The majority (59%) of Americans with an advisor believe that, if they work past traditional retirement age, it will be by choice rather than from necessity (41%). Notably, the inverse is true for those without an advisor, with 6 in 10 (61%) expecting to remain employed past retirement age from necessity
These are the latest findings from the 2018 Planning & Progress Study, an annual research project commissioned by Northwestern Mutual that explores Americans’ attitudes and behaviors toward money, financial decision making, and the broader landscape issues impacting people’s long-term financial security.
Not all advice is created equal
While the findings underscore the overall value of working with an advisor, Americans cited several attributes that distinguish a remarkable advisor experience from just an acceptable one. “Someone I can fully trust to have my best interests at heart/not just out to sell product” emerged as the leading priority (57%). Other factors included:
- “Not feeling judged on size of assets/financial decisions” (36%)
- “Deep expertise across a wide range of financial solutions and strategies” (33%)
The importance of relationship also resonated in preferences around the delivery of advice. 6 in 10 Americans said a human relationship combined with technology is ideal while only 11% opted for a fully automated solution.
Download the 2018 Planning and Progress Study - Advisors: Key to Financial Clarity
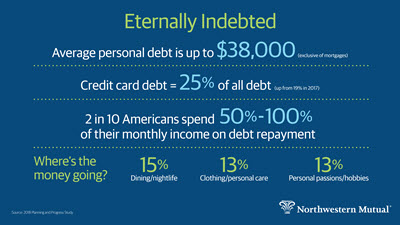
Though the majority of Americans (53%) cited debt reduction as their top 2018 financial priority, average personal debt (exclusive of home mortgages and among those with some debt) climbed higher this year, exceeding $38,000 compared to just over $37,000 in 2017. Additional new findings from Northwestern Mutual’s 2018 Planning & Progress Study further suggest that Americans are digging further into--rather than out of--debt:
- Americans are twice as likely to have accumulated $5,000-$25,000 in debt (33%) rather than personal savings (17%)
- Fewer people said they carry “no debt” this year compared to 2017 (23% vs. 27%)
- Two in 10 people allocate a staggering 50%-100% of their income towards debt repayment
- 1 in 10 (13%) Americans say they will be in debt for the rest of their lives
Notably, this year, credit cards tied mortgages as the leading source of debt, spiking from 19% to 25%. Educational loans (6%; 28% for Millennials ages 18 - 24) and car loans (7%) rounded out the top three.
This is the latest data released from the 2018 Planning & Progress Study, an annual research project commissioned by Northwestern Mutual, that explores Americans’ attitudes and behaviors toward money, financial decision making, and broader issues impacting people’s long-term financial security. Prior waves focused on retirement savings, money and emotions, and working with a financial advisor.
Anatomy of Debt
The cycle of “buy and borrow” continued this year. After covering off on basic necessities, Americans allocated nearly equal amounts of their monthly income to debt repayment and discretionary expenses (an average 36% and 37%, respectively).
Looking closer at the nature of discretionary spending, dining and nightlife emerged as the top category (15%). Other mentions included:
- Personal passions/hobbies: 13%
- Personal care: 13%
- Clothing: 13%
- Leisure travel: 10%
Interestingly, the data suggests that, in succumbing to their urge to splurge, Americans may be underplaying the implications of debt on financial health. In fact, the majority (56%) said that debt has “low” or “no impact” on their ability to achieve financial security.
Download the 2018 Planning and Progress Study - Depths of Debt
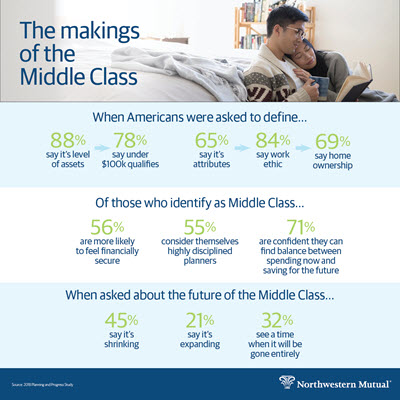
Americans are twice as likely to say the middle class is shrinking (45%) versus expanding (21%), according to new data from Northwestern Mutual’s 2018 Planning & Progress Study. Additionally, one in three (32%) Americans can see a time when the middle class completely disappears while a quarter more (24%) are uncertain of its future.
While the majority of Americans still classify themselves as middle class, the number has declined slightly, from 70% who called themselves middle class in 2017 to 68% who said the same this year.
This is the latest round of findings from the 2018 Planning & Progress Study, an annual research project commissioned by Northwestern Mutual, that explores Americans’ attitudes and behaviors toward money, financial decision making, and broader issues impacting people’s long-term financial security. Prior waves focused on debt, retirement savings, money and emotions, and working with a financial advisor.
Class Mobility
Further data provide additional insight into why Americans may be skeptical about the future of the middle class. Though six in 10 (60%) Americans believe that movement into or out of the middle class is possible, more anticipate mobility between the middle class and the poor versus the middle class and the wealthy:
- The least likely type of mobility cited was “middle class to wealthy” (39%) and “wealthy to middle class” (33%)
- One third (32%) said that movement is more likely from “middle class to poor” while 37% felt movement from poor to middle class was most likely
- Among the generations, younger Millennials, ages 18-24, are most likely to anticipate transition from “middle class to poor” (35%)
The Makings of the Middle Class
Like last year, Americans cited both personal attributes and asset levels as defining characteristics of the middle class. Interestingly, however, in the 2018 findings, there has been a significant shift in those who would define the middle class by a certain level of assets (88% vs 84% in 2017) versus attributes (65% vs 70% in 2017):
- The vast majority (78%) of Americans said assets under $100,000 would qualify one as middle class. Just over half (52%) said the range is between $50,000 to $99,999, and a quarter (26%) said less than $50,000
- In terms of values, it appears that being a part of the middle class is less associated with personality traits like humility (30%) and thriftiness (39%) and more with tangibles like work ethic (84%) and homeownership (69%)
- Men and those married/living with a partner are most likely to consider themselves middle class (72% vs 64% women, and 81% married men/73% married women vs 56% single men / 54% single women)
In terms of financial habits and perspectives, the 2018 Planning & Progress Study found that people who identify with being part of the middle class vs. those outside the middle class are:
- More likely to feel financially secure (56% vs. 24%)
- More likely to consider themselves “highly disciplined” or “disciplined” planners (55% vs 34%)
- More likely to feel confident that they can strike the right balance between spending now and saving for the future (71% vs 42%)
Download the 2018 Planning & Progress Study - The Makings of the Middle Class

Nearly one in three Millennials (29%) say financial planning makes them feel “excited and inspired,” according to new data from Northwestern Mutual’s 2018 Planning & Progress Study. This is more than double the amount of Baby Boomers (12%) who say the same, and substantially more than Gen Xers (22%).
Millennials are also more likely than other generations to say they are “highly disciplined” or “disciplined” financial planners with over half (57%) identifying themselves as being in one of those categories compared to only 49% of Gen Xers and 45% of Baby Boomers.
While those aged 18-34 demonstrate the strongest instincts for planning and discipline, they also feel the most anxious that they have the right strategy in place. More than eight out of 10 (82%) Millennials say their financial planning needs improvement, compared to only 63% of Baby Boomers and 79% of Gen Xers. Additionally:
-
Only 40% of Millennials say they have good clarity on how much they can afford to spend versus how much they should be saving for the future. That compares to 56% of Baby Boomers and 47% of Gen Xers.
-
A large majority (78%) of Millennials agree they feel pulled apart by the pressure to find the right balance between present and future financial responsibilities. This compares to only 57% of Baby Boomers and 74% of Gen Xers who say the same.
-
Almost one in three Millennials (29%) completely agree they feel afraid, uncomfortable, or guilty spending money even when they can afford to. That compares to 16% of Baby Boomers and 22% of Gen Xers.
This is the latest round of findings from the 2018 Planning & Progress Study, an annual research project commissioned by Northwestern Mutual that explores Americans’ attitudes and behaviors toward money, financial decision making, and broader issues impacting people’s long-term financial security. Prior waves focused on the middle class, debt, retirement savings, money and emotions, and working with a financial advisor.
Debt, Spending & Priorities
Millennials are carrying an average $36,000 in debt and put 34% of their monthly income toward paying it down. Interestingly, their overall debt levels are exactly on par with Baby Boomers who are also carrying $36,000 in debt, and slightly less than the $39,000 that Gen Xers are carrying. The single greatest source of Millennials’ debt comes from education loans (21%) and credit card bills (20%), whereas mortgages, followed by credit card bills, top the list for both Gen Xers (32%) and Baby Boomers (25%).
As for spending, 41% of Millennials’ monthly income goes towards discretionary costs. This is likely due to the fact that Millennials are earlier in their careers, so their incomes are typically lower than older generations.
In terms of financial priorities, Millennials say that saving enough for a milestone like marriage, college, or buying a house, is their top priority (54%). This is distinctly different than Baby Boomers and Gen Xers who say reducing debt is their top financial priority (53% and 55%, respectively).
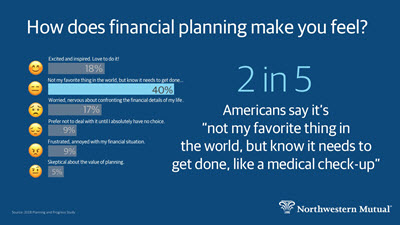
New research from Northwestern Mutual has found that when US adults aged 18+ are asked how they feel about financial planning, the far and away No. 1 answer is, “not my favorite thing in the world but know it needs to get done like a medical checkup” (40%). Nearly one in five (18%) say they are “excited and inspired, love to do it.” Another 40% combined expressed a range of negative emotions about planning, including:
-
Worried, nervous about confronting the financial details of my life (17%)
-
Prefer to not deal with it until I absolutely have no choice (9%)
-
Frustrated, annoyed with my financial situation (9%)
-
Skeptical about the value of planning (5%)
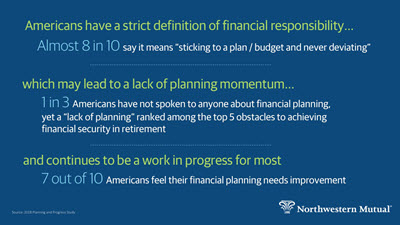
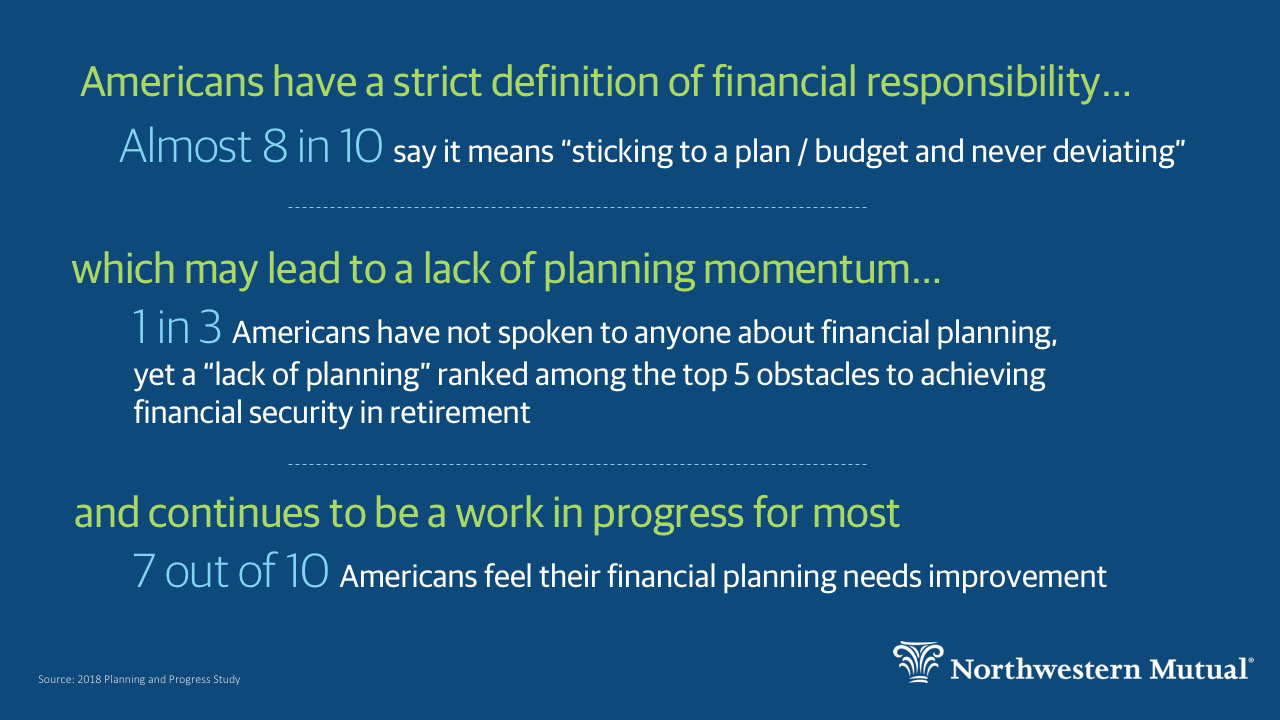
There is one issue that the majority of Americans agree on though – 70% say their financial planning needs improvement.
This is the last round of findings from the 2018 Planning & Progress Study, an annual research project commissioned by Northwestern Mutual that explores Americans’ attitudes and behaviors toward money, financial decision making, and broader issues impacting people’s long-term financial security. Previous waves explored retirement, the middle class, debt, the impact of money on emotions, and more.
Most people say they’re informal planners
When asked what type of financial planner people are, nearly half say either “disciplined” or “highly disciplined” but the single most common answer is “informal.” The exact breakouts are as follows:
-
16% say I am a “highly disciplined” planner. I know my exact goals, have developed specific plans to meet them, and rarely deviate from those plans.
-
33% say I am a “disciplined” planner. I know my exact goals and have developed specific plans to meet them, but those plans can deviate at times because I don't always stay on top of them.
-
37% say I am an “informal planner.” I have a general sense of my goals and how to meet them - however I do not have a plan in place.
-
14% say I am “not a planner” and have not established any goals.
Some of the reticence around planning may stem from the fact that almost 8 in 10 (79%) Americans agree that being financially responsible means “sticking to a budget and never deviating.”
Avoidance and Inaction
One in three Americans (34%) say they have not spoken to anyone about financial planning, according to the survey. And yet, a lack of planning is ranked among the top five obstacles to achieving financial security in retirement:
-
Lack of savings (48%)
-
Healthcare costs (48%)
-
The economy (35%)
-
Lack of planning (29%)
-
Social Security uncertainty (29%)