

Planning & Progress Study 2023
The 2023 Planning & Progress Study, an annual research study from Northwestern Mutual, explores U.S. adults’ attitudes and behaviors toward money, financial decision-making, and the broader issues impacting people’s long-term financial security.
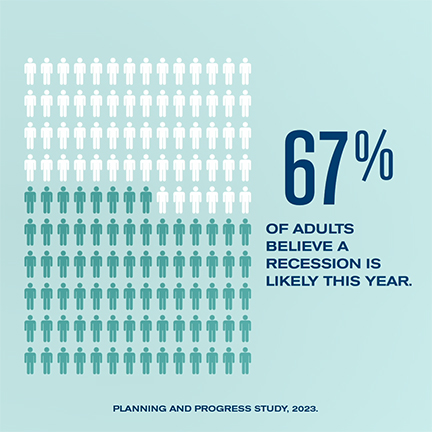
Two-thirds (67%) of U.S. adults expect the economy will enter into recession later this year – a key finding from Northwestern Mutual’s newly released 2023 Planning & Progress Study exploring Americans’ attitudes and behaviors toward their finances.
For those who see a recession looming, one-third (33%) say it will be short-lived, lasting a year or less, while one-fifth (19%) say it will last more than two years. And among those anticipating a recession, three out of four expect it to have a high or moderate impact on both their near-term (78%) and longer-term (75%) finances.
According to the research, most Americans are responding to economic uncertainty with action, making adjustments – small and large – to their financial priorities and choices.
Cutting costs tops list of measures being taken to address economic uncertainty
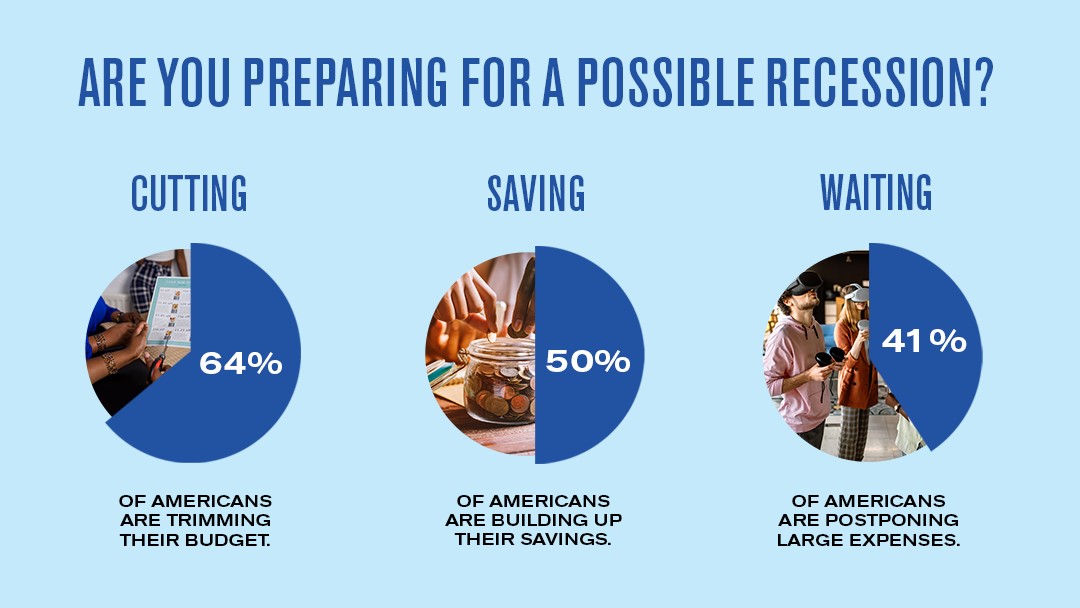 The top three steps people are taking include cutting costs (64%), building up savings (50%), and postponing large expenses until the economy is on more stable footing (41%). Even high-net-worth individuals – those with total household investable assets greater than $1 million – are building up savings (50%) and postponing large expenses (38%).
Personal savings are up… but not quite as high as inflation
This year’s study finds that, on average, Americans’ personal savings (excluding retirement assets) stand at $65,100 – a nearly 5% increase over the $62,000 reported last year, but short of the 6.5% inflation rate the U.S. economy saw in 2022.
Meanwhile, despite the Federal Reserve’s campaign to fight inflation by raising interest rates, more than half (54%) of Americans say they expect inflation to increase further this year versus 19% who say it will decrease and 27% who say it will stay the same.
Inflation and recession are top financial concerns for most people
 Not surprisingly, inflation (51%) and recession (26%) came in as people’s top financial concerns this year. Interestingly, coming in at #3 is an issue that has receded somewhat from the news cycle – gas prices (24%).
Gen Z agrees that inflation (38%) is the top financial concern. More than six in 10 (61%) of America’s youngest adults believe inflation will increase this year, with only 15% saying it will decrease. However, they say their next greatest financial worries are gas prices (26%), climate change (22%) and job stability (21%).
Uncertainty impacts younger people differently than older
Economic uncertainty is leading the majority of Americans (60%) to postpone plans and purchases of one kind or another. More than a third (36%) of people say they are postponing daily purchases like meals out, new clothes and event tickets. Three in 10 (29%) say they are shelving large purchases or projects like remodeling a home or buying a new car. For younger adults, the postponements also include putting some big life decisions on pause.
|
Postponed: |
Gen Z |
Millennials |
Gen X |
Boomers+ |
|
Buying or building a new home |
23% |
18% |
12% |
6% |
|
Changing jobs / searching for a new job |
29% |
19% |
10% |
3% |
|
Starting a business |
22% |
15% |
6% |
2% |
|
Getting married |
13% |
9% |
3% |
1% |
|
Having / adopting children |
9% |
8% |
1% |
0% |
Planning and risk
There is an exact 50/50 split between how people approach financial planning in America. Half of U.S. adults say they are disciplined, with 20% identifying as highly disciplined planners and 30% as disciplined. The other half identify as undisciplined, with 36% saying their planning is informal and 15% saying they don’t plan at all.
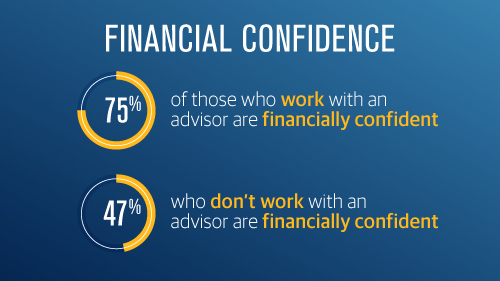
The good news is that a large majority (70%) of Americans say they have clarity on exactly how much they can spend now versus save for later. The number jumps to 83% for those who work with a financial advisor. About six in seven (86%) of those who identify as disciplined or highly disciplined planners feel this same financial confidence.
When it comes to risk, 63% of Americans say they’re very or somewhat tolerant of financial risk in their investments. Interestingly, comfort with risk goes up for people who work with advisors (71%), those who consider themselves disciplined or highly disciplined planners (72%) and high-net-worth individuals (79%).
The study found that just over half (52%) of U.S. adults say they have a financial plan that factors for up and down economic cycles over time. That compares to 84% of high-net-worth individuals who say the same, and 79% for those who work with an advisor.
Read the news release
Read the 2023 Planning and Progress Study - The Financial States of America
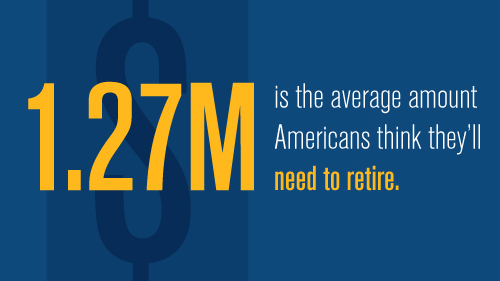 Americans believe they will need $1.27 million to retire comfortably. That number continues to increase, up from $1.25 million reported last year.
Meanwhile, the average amount that U.S. adults have saved for retirement modestly increased by 3% to $89,300 from $86,869 in 2022.
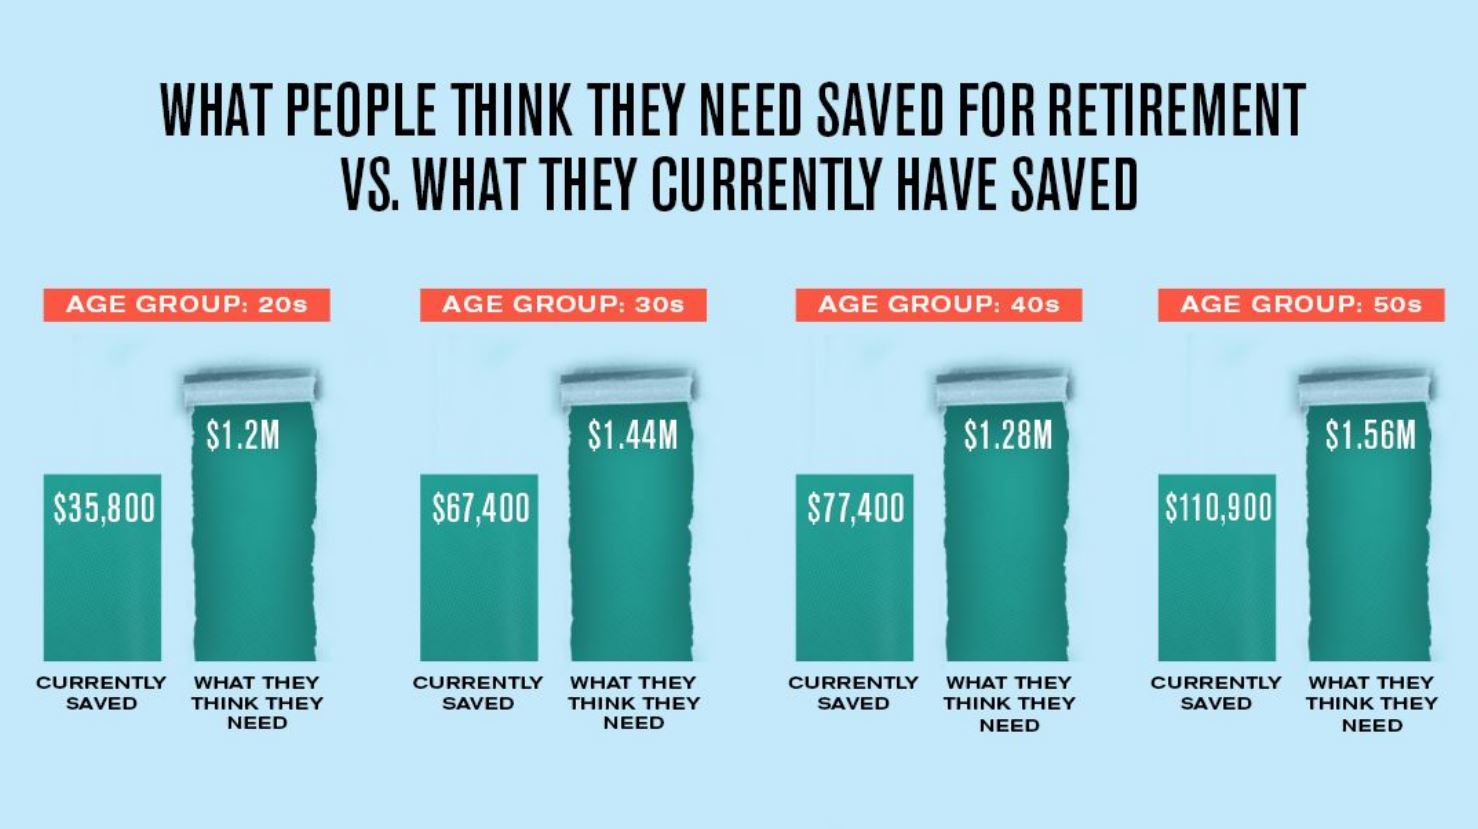
Among age groups, people in their 50s expect to need the most for a comfortable retirement – over $1.5 million. The numbers drop considerably for people in their 60s and 70s, largely because many of them are already in retirement.
|
|
All |
20s |
30s |
40s |
50s |
60s |
70s |
|
Amount expected to need for retirement |
$1.27M |
$1.20M |
$1.44M |
$1.28M |
$1.56M |
$968K |
$936K |
|
Amount saved for retirement currently |
$89,300 |
$35,800 |
$67,400 |
$77,400 |
$110,900 |
$112,500 |
$113,900 |
High-net-worth individuals – those with more than $1 million in investable assets – believe they’ll need $3 million to retire comfortably.
Retirement readiness and work timelines
Among generations, Gen Z is the most confident they’ll be financially prepared for retirement when the time comes. Older generations are more pessimistic – more than half of Gen X say they won’t be ready, and nearly half of Millennials and Boomers+ (not yet retired) say the same.
|
|
All |
Gen Z |
Millennials |
Gen X |
Boomers+ |
|
Expect to be financially prepared for retirement when the time comes |
52% |
65% |
54% |
45% |
52% |
|
Do not expect to be financially prepared for retirement when the time comes |
48% |
35% |
46% |
55% |
48% |
These retirement readiness feelings impact how long people expect to work. Boomers+ plan to work the longest (71) while Gen Z expects to retire more than a decade earlier (60). Millennials and Gen Xers plan to work to age 63 and 65, respectively.
Overall, Americans on average plan to work until the age of 65, up from 64 last year and 62.6 in 2021.
Interestingly, the study found that people who identify as disciplined financial planners knock off two years on their retirement age (63). Informal / non-planners add two years (67).
Imagining retirement… but worried about outliving savings
 The study explored what Americans are most looking forward to about retirement, as well as their greatest concerns. People are most looking forward to:
- Relaxing (55%)
- Getting family time (51%)
- Traveling (48%)
These have much greater appeal than things like volunteering (17%), a second career (13%), and doing something entrepreneurial (11%).
People are most concerned about:
- Declining health (44%)
- Outliving savings (43%)
- Boredom (31%)
Very few people said they were concerned about missing their career (16%).
On average, Americans say there is a 45% chance they outlive their savings and yet one third (33%) haven’t taken any steps to address it. For people who work with an advisor, the story is different – nine of out ten (89%) have taken steps to address the possibility of outliving their savings.
Living to 100
The study found three in ten (28%) Americans think it's likely they'll live to a 100. But expectations are much greater among younger adults, with 40% of Gen Z and Millennials expecting to hit triple digits.
Interestingly, more men (31%) than women (26%) think they’re likely to live to 100 when in fact mortality data suggests the opposite is true. Among centenarians in the United States today, 85% are women.
|
|
All |
Men |
Women |
Gen Z |
Millennials |
Gen X |
Boomers+ |
|
Likely / highly likely I’ll live to 100 |
28% |
31% |
26% |
40% |
40% |
22% |
20% |
Social Insecurity
More than four in ten Americans (42%) can imagine a time when Social Security no longer exists, according to the research.
And yet, people are relying on Social Security to provide 28% of their overall retirement funding. That’s more than personal savings (22%) and equal to retirement savings (28%).
Gen Z and Millennials have tempered expectations – they anticipate Social Security to deliver 15% and 19% of their overall retirement funding respectively. That’s a significant drop from what Boomers+ say – 38%.
|
|
All |
Gen Z |
Millennials |
Gen X |
Boomers+ |
|
Percentage of overall retirement funding people expect Social Security to deliver |
28% |
15% |
19% |
27% |
38% |
In forthcoming data sets, the 2023 Planning & Progress Study will explore wide-ranging issues facing Americans spanning debt, planning, wellness and more.
Read the 2023 Planning and Progress Study - Work & Retirement
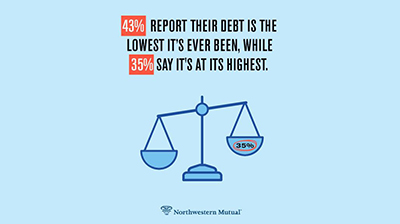
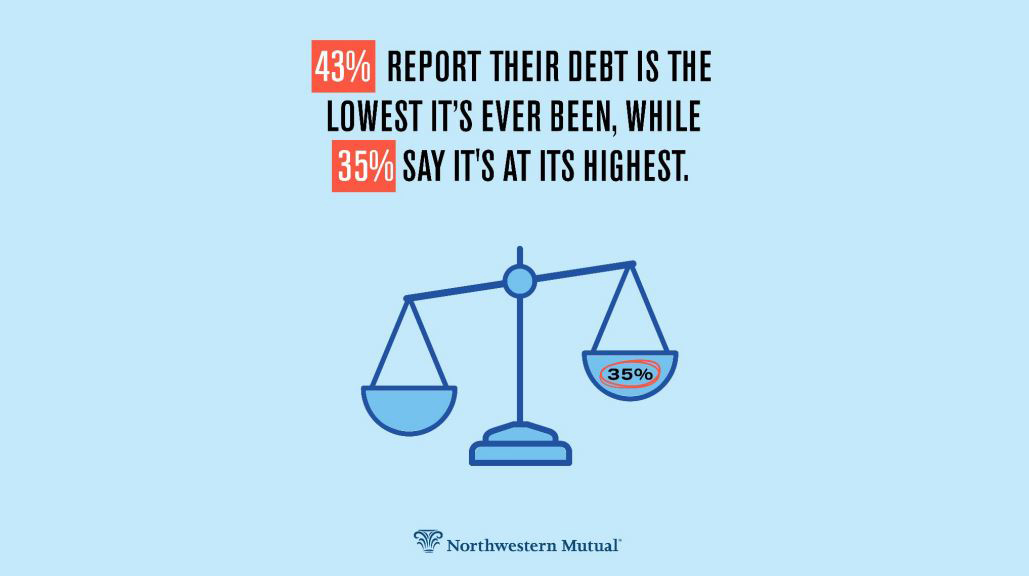
The average American’s personal debt exclusive of mortgages is $21,800, which is $8,000 less than what people reported in 2019. But underneath that topline number is a second story, about two very different experiences with debt. More than a third (35%) of Americans say they’re carrying close to or at their highest level of debt ever. At the same time, more than four in ten (43%) U.S. adults who have personal debt say they’re currently carrying close to or at their lowest level of debt ever.
|
Americans’ Personal Debt, Exclusive of Mortgages |
|
|
2023 |
$21,800 |
|
2022 |
$22,354 |
|
2021 |
$23,325 |
|
2020 |
$26,621 |
|
2019 |
$29,800 |
The primary source of personal debt in America can be found right in people’s wallets. According to the study, credit cards account for more than double any other single source of personal debt.
|
Top Source of Personal Debt |
2023 |
|
Credit cards |
28% |
|
Car loans |
12% |
|
Medical debt |
7% |
|
Home equity loans / lines of credit |
6% |
|
Personal education loans |
5% |
|
Educational expenses for children / family members |
3% |
People who carry personal debt say 30% of their monthly income goes toward paying it off, and most also expect to remain in debt for years.
|
How Long People Expect to Be in Debt |
2023 |
|
1-5 years |
49% |
|
6-10 years |
21% |
|
11-20 years |
8% |
|
For the rest of my life |
10% |
|
Don’t know |
12% |
Discovering a Debt Divide
The research finds that more than four in 10 (43%) U.S. adults who have personal debt say they’re currently carrying close to or at their lowest level of debt ever. At the same time, more than a third (35%) say they’re carrying close to or at their highest level of debt ever.
With respect to priorities, the research found that most people’s instincts are to get out of debt before building savings. Sixty-one percent say they prioritize paying down debt versus 39% who put saving first.
Student Loans Weigh Heavily on Gen Z and Millennials
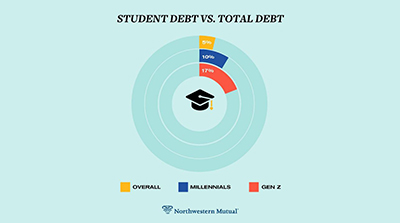
The study results indicate that student debt still weighs heavily on younger generations. Overall, 5% of survey participants cited personal education loans as their top source of debt. For Gen Z, it’s more than triple that (17%) and for Millennials it’s double (10%).
|
Student Loans as the Top Source of Personal Debt |
2023 |
|
Generation Z |
17% |
|
Millennials |
10% |
|
All |
5% |
|
Generation X |
3% |
|
Boomers+ |
1% |
Americans say their financial planning needs improvement and that having a financial advisor boosts confidence, yet only 37% work with one.
 The data finds that two-thirds of Americans (66%) believe their financial planning needs improvement, a 4 percentage-point uptick from the previous year. This was especially true among younger adults (79% for both Gen Z and Millennials, up 5 percentage points from last year for each generation). One factor driving this could be the current economic landscape. Nearly one in five people (18%) say that recent economic uncertainty has led them to either begin working with a financial advisor or plan to work with one at a later date.
Financial advisors boost confidence
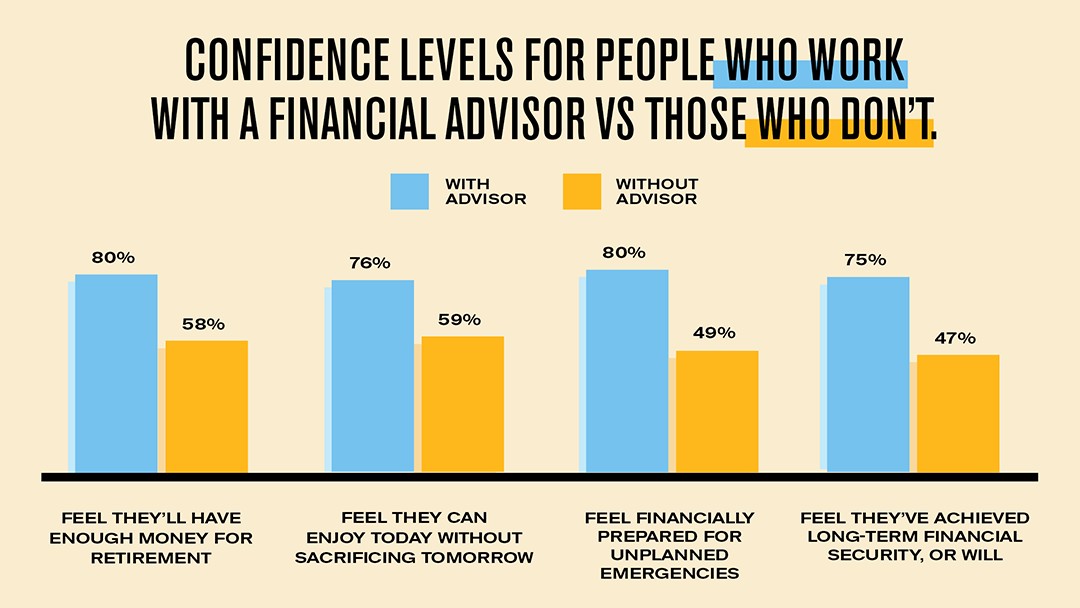
The research shows that people who work with an advisor have significantly higher levels of confidence across a range of areas, including being prepared for unplanned expenses (31 percentage points higher), being able to retire when the time comes (29 percentage points higher) and achieving long-term financial security (28 percentage points higher).
|
How financial advice impacts confidence |
Individuals who work with an advisor |
Individuals who do not work with an advisor |
|
I have had/will have a successful career |
85% |
62% |
|
I will have enough money for retirement (retirees) |
80% |
58% |
|
I can enjoy today without sacrificing happiness in the future |
76% |
59% |
|
My financial planning incorporates the possibility of unplanned financial or health emergencies |
80% |
49% |
|
I have achieved/will achieve long-term financial security |
75% |
47% |
|
I will have enough money to retire when the time comes (non-retirees) |
74% |
45% |
|
Social Security will be there when I need it |
66% |
49% |
Advisors are considered the most trusted source for financial advice
Americans say that financial advisors are the most trusted source of financial advice, outpacing spouses, family members, business news, friends and social media.
While Gen Z and Millennials may spend a significant amount of time on social networks, the vast majority are not turning to those channels for trustworthy financial guidance. Both groups ranked financial advisors among the most trusted sources of financial advice – #1 for Millennials and #2 for Gen Z, second only to family members.
|
Most trusted source for financial advice |
All |
Gen Z |
Millennials |
Gen X |
Boomers+ |
|
Financial advisor |
31% |
22% |
25% |
35% |
35% |
|
Spouse/partner |
17% |
12% |
20% |
15% |
16% |
|
Family member |
14% |
28% |
19% |
12% |
8% |
|
Business news |
8% |
11% |
6% |
8% |
9% |
|
Friend |
4% |
4% |
7% |
4% |
2% |
|
Financial influencers / social media (Reddit, TikTok, etc.) |
3% |
6% |
4% |
2% |
0% |
Older Americans want an advisor with expertise, while younger generations prioritize advisors who align to their values, save them time, and keep them up-to-date
The data finds two leading reasons people turn to advisors for financial guidance: for their professional expertise and to help them maintain a long-term view that keeps them on track to achieve goals (both at 48%). Interestingly, Gen Z and Millennials were more likely than other generations to turn to an advisor for help aligning their finances with their values, saving time and keeping up to date on things like changes to the tax code.
|
Reasons individuals turn to an advisor |
All |
Gen Z |
Millennials |
Gen X |
Boomers+ |
|
Offers professional expertise I don't have |
48% |
28% |
29% |
50% |
66% |
|
Helps me keep a long-term view so I can achieve goals such as a financially secure retirement |
48% |
30% |
43% |
54% |
51% |
|
Helps me reduce my financial anxiety and provide peace of mind |
44% |
31% |
37% |
44% |
53% |
|
Helps me plan and keeps me organized, disciplined and on track |
43% |
35% |
47% |
47% |
37% |
|
Helps me align my finances with my values |
31% |
33% |
40% |
24% |
29% |
|
Keeps me up to date on things like changes in the tax code |
31% |
39% |
33% |
29% |
29% |
|
Saves me time |
31% |
44% |
42% |
30% |
19% |
Additionally, when selecting an advisor to work with, respondents said they prioritize someone who understands their life stage priorities (54%) and who has a long track record of experience (51%). When looking across generations, however, priorities begin to differ. Gen Z and Millennials, for example, place a higher premium on working with an advisor who is tech-forward and demographically similar to them.
|
Reasons for choosing an advisor |
All |
Gen Z |
Millennials |
Gen X |
Boomers+ |
|
Understands the priorities for someone in my stage of life |
54% |
42% |
47% |
52% |
63% |
|
A long track record of experience |
51% |
32% |
42% |
58% |
58% |
|
Tech-forward and accessible to communicate with beyond in-person meetings |
21% |
25% |
29% |
16% |
18% |
|
Demographically similar to me (e.g., age, gender, race/ethnicity, sexual orientation) |
21% |
28% |
34% |
18% |
12% |
Americans feel significantly more confident in areas of their lives outside of their finances and more than a third (36%) say financial uncertainty keeps them up at night at least monthly.
 When asked to rate how strong they feel about the current state of various areas of their lives, eight in ten U.S. adults (79%) say they feel strong or very strong about their friendships; three-quarters say the same about their mental health (75%) and physical health (74%); and seven in ten (69%) say the same about their job stability. However, only slightly more than half of people (57%) say they feel strong or very strong about the current state of their finances, a relative weakness compared to other parts of life.
The Arc of Anxiety
The study found that financial anxiety tends to follow an arc as people move through life. In general, financial uncertainty is elevated for Gen Z, peaks for Millennials, begins to recede for Gen X and sits at its lowest levels for Boomers+. For example, more than a third (36%) of Americans say uncertainty about their finances keeps them up at night at least once a month. That number is even higher for Gen Z (44%) and is highest among Millennials (53%).
Financial uncertainty causes the following issues across generations at least once a month:
|
|
All |
Gen Z |
Millennials |
Gen X |
Boomers+ |
|
Made you feel depressed |
37% |
47% |
54% |
39% |
20% |
|
Kept you up at night |
36% |
44% |
53% |
37% |
19% |
|
Created issues with family members/friends (other than spouse/partner) |
26% |
42% |
45% |
23% |
10% |
|
Impacted your relationship with your spouse/partner |
26% |
35% |
42% |
25% |
9% |
|
Made you physically ill |
23% |
34% |
38% |
22% |
8% |
|
Impacted your job performance |
22% |
39% |
38% |
23% |
5% |
Planning for financial wellness
Results from the study indicate that those who work with a financial advisor and those who identify as disciplined financial planners are more likely to report greater feelings of strength about the current state of various aspects of their lives, both personal and professional.
|
Feel strong or very strong about: |
All |
Financial Advisor |
Type of Planner |
||
|
Yes |
No |
Disciplined |
Undisciplined |
||
|
Friendships |
79% |
87% |
75% |
85% |
73% |
|
Mental health |
75% |
85% |
70% |
84% |
66% |
|
Physical health |
74% |
83% |
70% |
84% |
65% |
|
Job stability |
69% |
77% |
64% |
80% |
57% |
|
Finances |
57% |
75% |
47% |
76% |
38% |
Wealthy Americans don’t sit back and assume they have nothing to be concerned about financially.
U.S. adults aged 18+ with more than $1 million in investable assets are active, disciplined long-term planners who take very little for granted: nearly half (47%) say their financial planning still needs improvement, and a third (33%) think it’s possible they could outlive their savings. The study finds 84% of wealthy people say they have a long-term financial plan that factors for up and down economic cycles. That compares to 52% who say the same among the general population.
When it comes to financial planning, wealthy Americans demonstrate high levels of discipline in comparison to the general population.
|
Type of planner you consider yourself |
$1M+ in investable assets |
General Population |
|
I am a highly disciplined planner. I know my exact goals, have developed specific plans to meet them, and rarely deviate from those plans. |
42% |
20% |
|
I am a disciplined planner. I know my exact goals, and have developed specific plans to meet them, but those plans can deviate at times because I don't always stay on top of them. |
35% |
30% |
|
I am an informal planner. I have a general sense of my goals and how to meet them; however, I do not have a formal plan in place. |
20% |
36% |
|
I am not a planner and have not established any goals |
3% |
15% |
Wealthy Americans trust financial advisors
The study finds seven out of ten (70%) wealthy Americans work with a financial advisor, nearly double the amount of the general population (37%).
Over half (53%) of wealthy people consider advisors to be their most trusted source of financial advice – that’s more than four times any other source. Spouses/partners ranked a distant second at 11%, followed by business news at 10%.
Recent economic uncertainty has led to a re-evaluation among some wealthy Americans. Nearly half (48%) of wealthy people who work with an advisor said that, if they were seeking a change, they would select another advisor who could offer more comprehensive financial guidance than their current advisor. One-third (34%) would switch to someone who has a better understanding of their life stage and priorities.
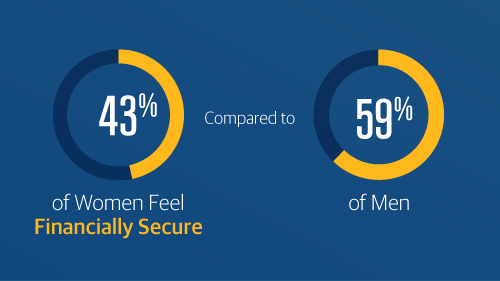
Fewer women in America feel financially secure or confident in their retirement readiness than men. Just four in ten (43%) American women feel financially secure and 44% think they will be financially prepared for retirement. This compares to 59% of men who feel financially secure and 61% who think they will be financially prepared for retirement.
 More than 6 in 10 (63%) men in America believe Social Security will be there when they need it; meanwhile, less than half (48%) of women overall agree. Beyond the notable differences between women and men, the findings also reveal some interesting generational differences among women. Six in ten (63%) Boomers+ women are confident Social Security will be there when they need it – more than Gen Z women (48%), Millennials (39%) and Gen X (37%).
Gen Z women are more optimistic about their longevity and financial futures, but also stand out for what concerns them about life in retirement
Four in 10 (39%) Gen Z women and a third (32%) of Millennial women believe they’ll live to 100. That compares to 23% of Gen X and 20% of Boomers+.
Interestingly, nearly 6 in 10 Gen Z women (59%) believe they will be financially prepared for retirement – a significantly higher proportion than reported by women in other generations: Millennials (43%), Gen X (38%), and Boomers+ (48%).
Women’s greatest concerns about retirement align closely with those of men – outliving savings (45%), declining health (41%), and boredom (30%). But Gen Z women are significantly more concerned than their older female counterparts about isolation from friends, family and coworkers; missing their career; and drifting (i.e., feeling uncertain or indecisive about where to focus their time, attention and energy).
|
Biggest fears/concerns about retirement |
All women |
Gen Z women |
Millennial women |
Gen X women |
Boomers+ women |
|
Outliving your savings |
45% |
41% |
39% |
52% |
46% |
|
Declining health |
41% |
42% |
30% |
50% |
49% |
|
Boredom |
30% |
36% |
29% |
27% |
34% |
|
Drifting, feeling uncertain or indecisive about where to focus your time, attention and energy |
17% |
34% |
17% |
14% |
14% |
|
Isolation from friends, family, coworkers |
14% |
25% |
15% |
10% |
14% |
|
Missing your career |
13% |
23% |
15% |
9% |
12% |
Gen Z and Millennial women say they need to get better at financial planning; Gen X and Boomers+ aim to pay down debt
Among women, younger generations are most inclined to say their financial planning needs improvement. While two-thirds (66%) of women overall think their financial plans need improvement, younger women are most inclined to agree: Gen Z (79%) and Millennial (76%).
Younger generations of women are also more likely to prioritize saving over paying down debt than their older counterparts. Conversely, older generations of women are more likely to prioritize paying down debt over saving.
|
Which do you prioritize more? |
All women |
Gen Z women |
Millennial women |
Gen X women |
Boomers+ women |
|
Saving money |
36% |
53% |
48% |
33% |
21% |
|
Paying down debt |
64% |
47% |
52% |
67% |
79% |
Gen X women are least likely to have a long-term financial plan, and most likely to say they won’t be financially ready for retirement
Nearly six in 10 women (58%) say they don’t have a long-term financial plan that factors for up and down economic cycles. For Gen X women, it’s two-thirds (67%). This is compared to 52% for Gen Z and Millennial women, and 57% for Boomers+ women.
Gen X women (38%) are also the least likely to say they will be financially prepared for retirement when the time comes.
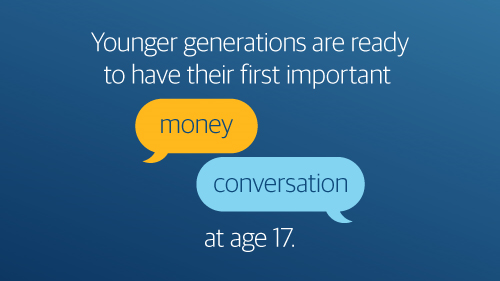 Younger Americans say they are ready to have conversations about more sensitive family financial topics earlier on in life. From family budgets to inheritances to estate planning, the time to talk is trending sooner.
The average American says the right time to talk with kids about their family’s financial situation is at age 17. However, the research discovered some significant differences across generations: Boomers+ say they had that first conversation when they were 22, while Generation Z had it seven years earlier at age 15.
|
When did you & when should you have the first money conversation |
All |
Gen Z |
Millennials |
Gen X |
Boomers+ |
|
Average age people think kids should be when they have their first conversations about family finances with parents/guardians |
17 |
15 |
16 |
16 |
18 |
|
Average age people were when they had their first conversation about family finances with parents/guardians |
19 |
15 |
18 |
20 |
22 |
Northwestern Mutual’s study also found that Gen Z is the most likely to consider “family members” as the most trusted source for financial advice, followed by financial advisors. These sources score 15-to-20 percentage points higher than the often-popularized “FinTok” influencers on social media.
|
Most trusted source for |
All |
Gen Z |
Millennials |
Gen X |
Boomers+ |
|
Family member |
14% |
28% |
19% |
12% |
8% |
|
Financial advisor |
31% |
22% |
25% |
35% |
35% |
|
Spouse/partner |
17% |
12% |
20% |
15% |
16% |
|
Business news |
8% |
11% |
6% |
8% |
9% |
|
Financial influencers / social |
3% |
6% |
4% |
2% |
0% |
|
Friend |
4% |
4% |
7% |
4% |
2% |
Talking to Aging Parents About Their Wishes
According to the study, nearly three in 10 (29%) U.S. adults have talked to their parents or guardians about their wishes regarding inheritance, will provisions and other matters related to their estates. But here again, there are signals in the data showing younger generations are placing a greater priority on having those conversations sooner.
When asked when people should initiate that talk with their parents/guardians, there was a full 10-year gap between what Boomers+ and Millennials suggested.
|
|
Gen Z |
Millennials |
Gen X |
Boomers+ |
|
What age should you be when you start talking to your parents and guardians about their wishes regarding inheritance, wills, and estate plans? |
47 |
45 |
51 |
55 |
Another topic that is likely to come up sooner with aging parents and guardians is their preferences and options regarding long-term care. Just over four in 10 (43%) U.S. adults have had that conversation already. But younger generations are, once again, placing a greater priority on having that conversation sooner.
|
|
Gen Z |
Millennials |
Gen X |
Boomers+ |
|
What age should you be when you start talking to your parents and guardians about their long-term care preferences? |
42 |
40 |
49 |
53 |
Read the 2023 Planning and Progress Study – Money Conversations
 December is, by far, the most popular month for couples in the U.S. to pop the big question, but many Gen Z’ers and Millennials think an honest conversation about money should happen well before marriage proposals.
Nearly one-third (32%) of Gen Z say the conversation about money should occur even before a relationship gets serious, and among Millennials the number is even higher (40%). More than 7 in 10 Americans (72%) across all ages believe this discussion should occur “well ahead of marriage or living together.”
|
When an honest conversation about money should occur |
All |
Gen Z |
Millennials |
Gen X |
Boomers+ |
|
In the first few days and weeks of your relationship |
10% |
7% |
14% |
10% |
6% |
|
After the initial stage of getting to know one another but before you decide to get serious |
20% |
25% |
26% |
17% |
16% |
|
After you’re serious but well ahead of marriage or living together |
42% |
38% |
32% |
49% |
47% |
|
Right before marriage or moving in together |
11% |
15% |
10% |
10% |
12% |
|
Shortly after marriage or moving in together |
3% |
5% |
3% |
1% |
4% |
|
Well after marriage or moving in together |
4% |
2% |
2% |
2% |
6% |
|
Never |
11% |
8% |
12% |
10% |
10% |
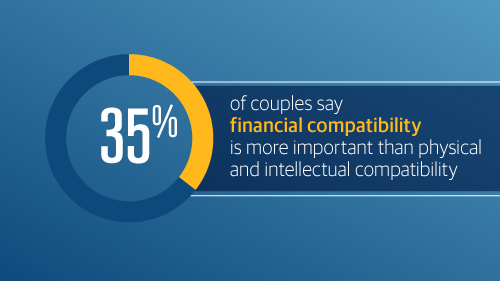
The Value of Financial Compatibility
Money lies at the heart of many couples’ relationships – over a third (35%) say financial compatibility is more important than physical and intellectual compatibility. For younger couples, money is an even greater priority – half (49%) of Gen Z think financial compatibility is more important than physical compatibility.
|
Financial compatibility is more important than… |
All |
Gen Z |
Millennials |
Gen X |
Boomers+ |
|
Physical compatibility |
35% |
49% |
40% |
35% |
30% |
|
Intellectual compatibility |
35% |
43% |
35% |
32% |
35% |
|
Emotional compatibility |
14% |
20% |
13% |
14% |
14% |
|
Lifestyle and interests compatibility |
29% |
41% |
31% |
29% |
27% |
|
Spiritual compatibility |
41% |
49% |
35% |
42% |
43% |
Financial Compatibility Gets Better with Age
The survey found that younger couples struggle more than older couples with seeing eye-to-eye on finances, and that can cause a significant strain on their relationships. Boomers+ are almost 20 percentage points more likely than Gen Z to say that they see eye-to-eye with their partner about managing money. Boomers+ are also 25 percentage points less likely than Millennials to say that finances are a significant issue in their relationship.
|
Seeing eye-to-eye |
Gen Z |
Millennials |
Gen X |
Boomers+ |
|
Always or most of the time see eye-to-eye in how to manage household expenses |
67% |
77% |
72% |
85% |
|
Money strains |
Gen Z |
Millennials |
Gen X |
Boomers+ |
|
Finances are a significant challenge / the single most difficult issue we deal with in our relationship |
34% |
42% |
27% |
17% |
The good news is that financial challenges within relationships seem to improve with time. While 24% of Gen Z say that one person in the relationship blames the other for a financial decision that led to a significant loss of money, just 4% of Boomers+ said the same. Almost across the board, reports of financial challenges in relationships tended to slope downward over time – as couples address financial issues, establish joint financial goals and plans, generate more income, and accumulate more wealth.
|
Financial Challenges in a Relationship |
Gen Z |
Millennials |
Gen X |
Boomers+ |
|
Merging and managing finances together has revealed differences in our approaches to spending and saving |
26% |
27% |
18% |
14% |
|
We have different tolerance levels for financial risk and that has made investment decisions difficult |
31% |
22% |
18% |
12% |
|
We have different incomes, and it has been hard to strike a balance of how to split expenses |
32% |
22% |
20% |
7% |
|
One of us brought significantly more assets to the household, and it has therefore never felt like an equal partnership |
25% |
21% |
14% |
8% |
|
One of us brought significantly more debt to the household, and it has been a point of tension |
18% |
23% |
12% |
5% |
|
One of us blames the other for decisions that led to a loss of a significant amount of money (e.g., investments that didn't pan out, a failed venture or otherwise) |
24% |
16% |
14% |
4% |
Among couples who have been together for more than five years, partners are much more likely to report becoming more financially compatible over time.
|
Financial Compatibility Over Time |
Millennials |
Gen X |
Boomers+ |
|
We've become more compatible financially over time |
52% |
42% |
46% |
|
We've become less compatible financially over time |
21% |
14% |
7% |
|
Our financial compatibility hasn't changed |
26% |
45% |
47% |
Not all Northwestern Mutual representatives are advisors. Only those representatives with “Advisor” in their title or who otherwise disclose their status as an advisor of Northwestern Mutual Wealth Management Company (NMWMC) are credentialed as NMWMC representatives to provide advisory services.